Another Meta-genomic Sequencing Model!
Previously we put together a model to allow qPCR and sequencing based diagnostic approaches to be compared. This model was parameterized as follows:
Total RNA: 10ng
Genome Size: 30Kb
rRNA fraction: 60%
qPCR Target Region: 90nt
Fragment Size: 1000nt
Read Count: 40M
Using this model we could calculate the fraction of reads (fragments) we’d see with sequencing and an expected CT value, matching the model against data from a recent publication:
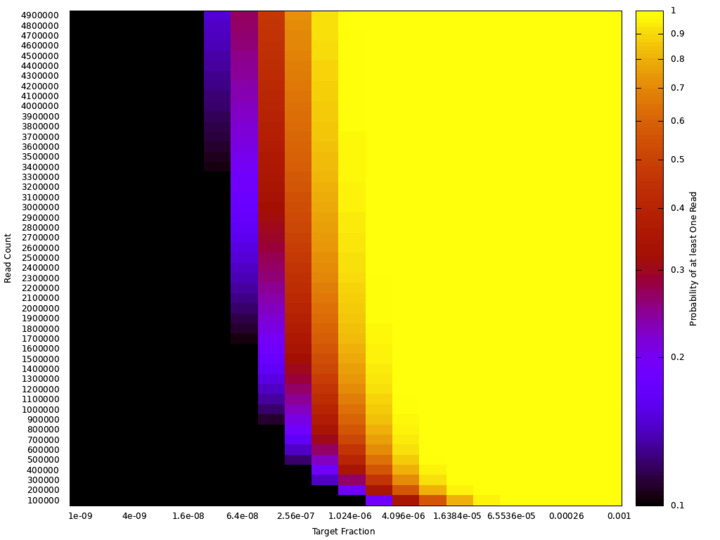
The model itself output the “expected number of reads” for sequencing as well. As some folks pointed out (thanks!) the distribution of read counts between samples will follow a Poisson distribution. Meaning that a significant fraction of runs will have zero reads. What we are perhaps more interested in the probability of seeing “at least one read”. To maintain a < 1 in 1000 false negative rate this should be 0.999.
The plot below shows how “probability of signal read” varies with read count and target fraction:
We can use this plot to determine the approximate number of reads required for a given target fraction. For example to have a probability of seeing at least one read > 0.999 we will require > 3.5M reads.
Below I’ve relabeled the same plot with the expected CT values of a qPCR test assuming the same parameters shown above (but vary read count/target fraction):
Hopefully you can see where sequencing would be effective from the plot. For example if you only want CT 30 equivalent sensitivity, you can get away with ~200K reads. With 1M you’re roughly CT 33 equivalent.
Code for the model is here! Quite possible that I’ve made some kind of mistake, corrections and comments welcome (new@sgenomics.org or Discord)!


