
What Happens In An Illumina Cycle?
Recently I was trying to figure out how the various steps in each sequencing cycle in Illumina sequencing break down. Illumina helpfully show the cycle time for each of their platforms:
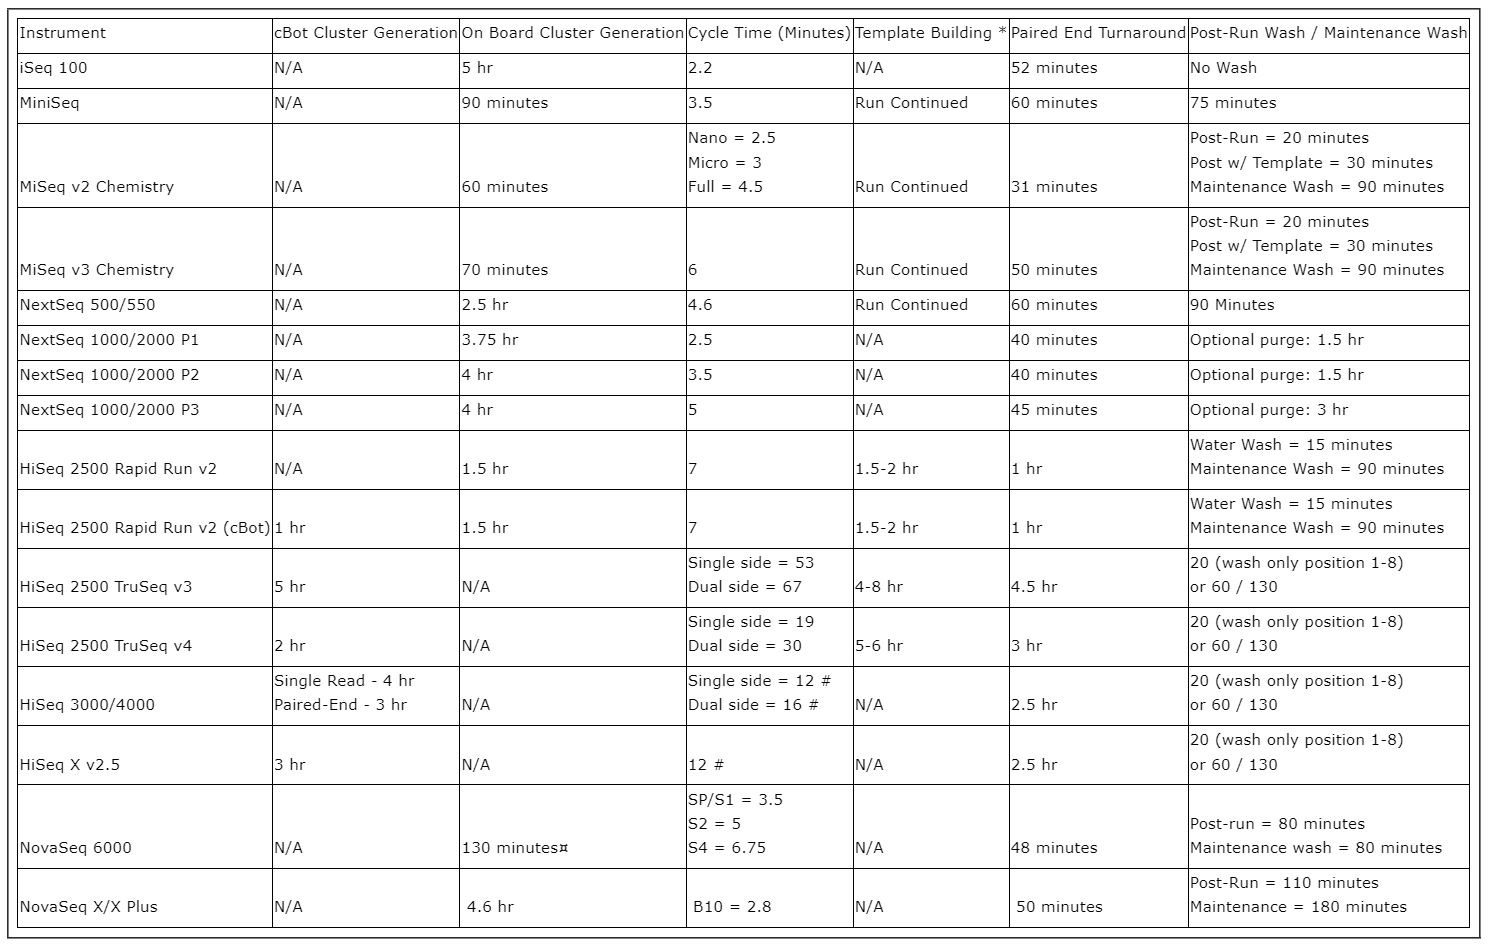
They provide this so you can estimate total run time. Each cycle advances the read one base position. So total run time should be cycle time * read length + cluster generation time + paired end turnaround time.
Cycle time varies significantly by platform from 2.2 minutes on the iSeq to 67 minutes on the (now discontinued) HiSeq 2500.
But I’m more interested in what actually goes on in each cycle and how long each step takes. To advance one base position a number of chemical and electro-mechanical steps will need to be performed. Patents from the Genome Analyzer 2 era describe the original process:
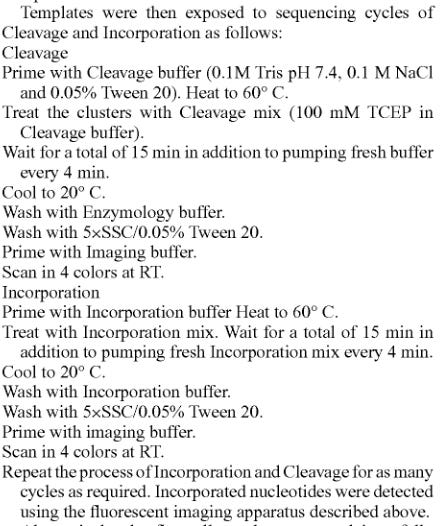
Which we can summarize as follows:
Cleave off old terminators/labels.
Wash.
Image the flowcell (not really required).
Incorporation.
Wash.
Add Imaging buffer.
Image the flowcell.
The patent referenced above give us rough numbers for Genome Analyzer. But cycles have got a lot faster since then and imaging areas increased significantly! So, let’s try and figure out what’s going on on more recent instruments like the NovaSeq!
Our first hint is that on the NovaSeq 6000 SP and S1 flowcells (which have the same area) have the same cycle time (3.5m). S2 and S4 flowcells have increasing cycle time (5m and 6.75m) and flowcell area. Broadly this increase in cycle time should be due to imaging a larger flowcell (as fluidic and incubation times I imagine should be similar).
Luckily the flowcell widths are public:

So from S1 to S2 area is increasing by ~1.3x. Cycle time isn’t quite increasing by the same factor (~1.4). The whole thing is unfortunately complicated by imaging area seemingly not quite matching physical lane width:
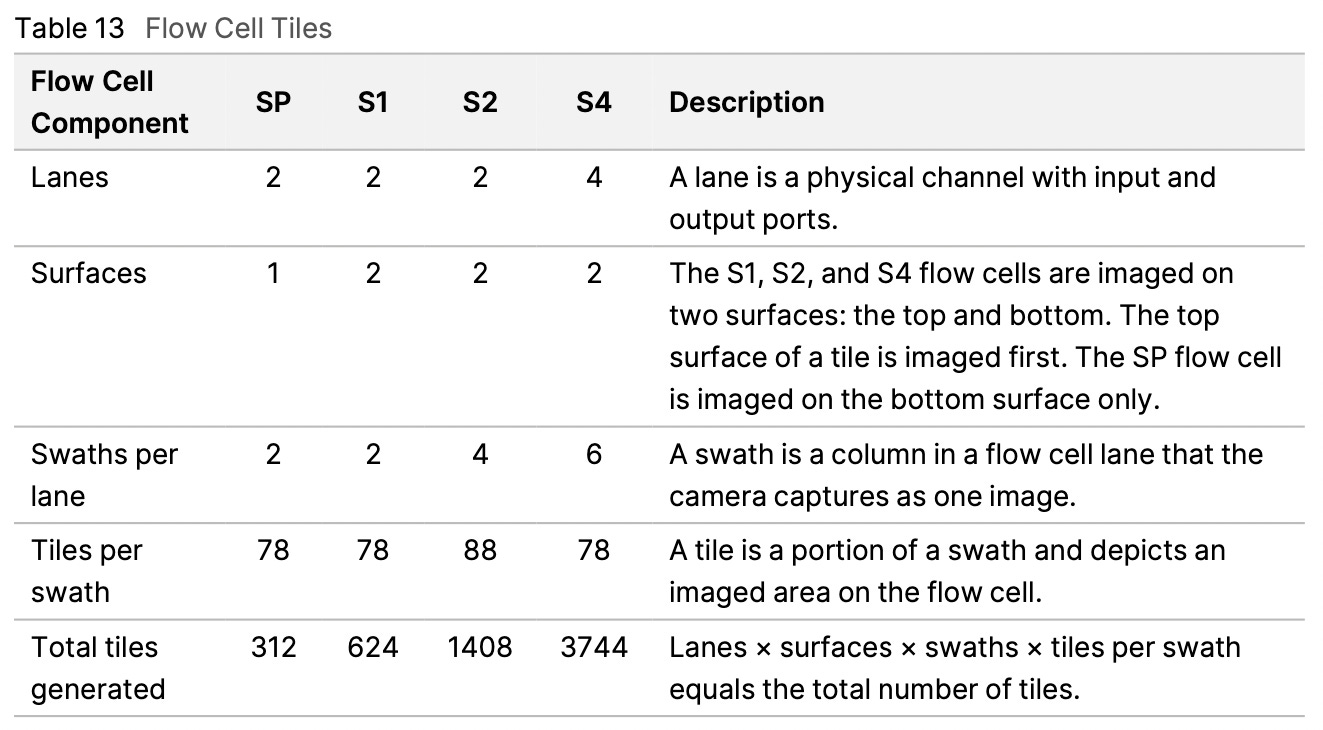
So while the physical area increase by 1.3, the number of tiles is increasing by 2.25. My guess is that the “tiles per swath” listed is possibly misleading. And that actually the same area is imaged, it’s just that on the S1 some of this falls off the edge of the lane and produces no useful data.
In short, the S2 imaged area seems likely double the S1 based on the numbers above.
Running these numbers would suggest the imaging takes about 1.5mins on the S1 and 3mins on the S2 leaving 2mins for other chemistry steps. We can also find support for this elsewhere.1
Let’s now try and find references discussing incorporation and cleavage step times, to see if we can get this to fit together…
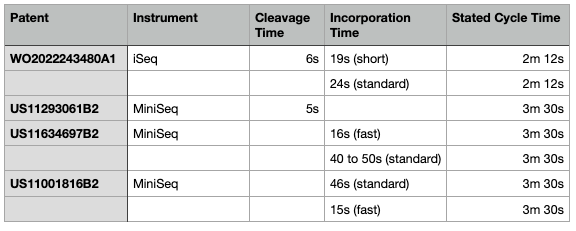
These numbers seem surprisingly low! But I suppose we’ve only got 2mins for 4 chemistry steps in anycase!
I would assume just loading a NovaSeq flowcell takes substantially longer than the MiniSeq and iSeq. Frobnicating the numbers above (and a fair amount of random guessing) I come up with the following for an S1 flowcell (using our 1.5min imaging estimate from above).
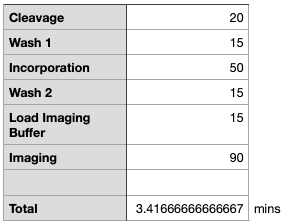
What do you think? Any thoughts or better numbers?
As always a few brief thoughts after the break!