One comment I had on the previous post was that the percentage of Oxford Nanopore’s revenue coming from consumables is high (75%) and that this is a good sign.
To evaluating a company seems more nuanced than looking at any single metric.
But there are several potential issues unique to Oxford Nanopore when looking at consumable versus instrument revenue. Let’s discuss this a little.
Oxford Instruments Are Cheap So Will Not Generate Much Revenue Anyway
The first is of course that Oxford Nanopore supply the majority of their instrument under lease agreements. This is somewhat unique to Oxford Nanopore in sequencing. From this fact alone we might expect lower instrument revenue in the short term.
Secondly, Oxford Nanopore lease the cheapest DNA sequencers, but sell expensive consumables. Their cheapest flowcell1 is $450. Their cheapest instrument is $10002. A consumable which costs 50% of the instrument cost is unique to Oxford Nanopore3.
Compare this to Illumina’s cheapest instrument (the iSeq 100) which at $20000 with ~$1000 has a run cost of 5% of instrument cost. And even this is an outlier for Illumina. Run costs of <1% of instrument cost would be more typical.
Customer Growth Seems To Be Slowing
But you can also imagine that a high percentage of consumable revenue might indicate slowing instrument sales. If you’re not selling instruments, but largely supporting existing customers this would be the case.
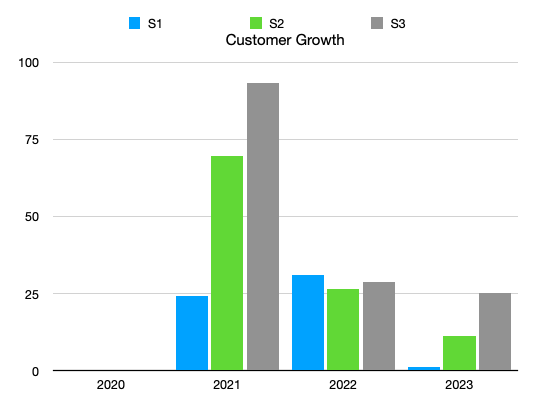
So I looked at growth in customer segments which Oxford broadly breakdown as S1, S2 and S3. S1s are <$25K, S2s <$250K and S3 >$250K. Based on the statements made at JPM4 and their previous reports5 growth seems to be slowing across all customer groups:
The smallest drop is in the S3 customer growth, this is positive for ONT as the majority of revenue seems to come from S3 users.
As an aside, Oxford’s share price hit an all time low again today.
And as always… Subscribe!!
Excluding the Flongle which is sold in packs and by all accounts doesn’t work super well anyway…
Based on statements, the starter pack is $1999 now it seems.
I’m unaware of any other example of this in life science tools.
“Our S1 customers we have over 7000 of those. They spend up to 25000 the mean spend 6000. Our medium customers S2 we have around 1100, they spend 25 to 250 thousand mean of 60000 and then we have 90 large high throughput customers excluding our Emirati [?] genome program and their mean spend is 600000”


Really interesting analysis Nava, in the context of this year (2024) being the 'breakout' year for them (and PacBio) reaching over some $210M and $200M in sales apiece. Yet similar stories between both ONT and PACB...
A lot of time (founded in 2005, MinION in 2015), money (how much cash did it burn before becoming a public company?) and effort (lots of effort) only to come up with a 169M GBP sales for 2023 while the investors expected 177M GBP. That's only 5% short, however you always want to surprise to the up-side, which Illumina became somewhat famous for doing. PACB also disappointed.
It's a game of setting expectations and then beating them, which is really hard to do.